Analytics and reports
See your farm in numbers: average weight, gain, profit per head, mortality and sales over any period you choose. Charts show where the money goes and how the flock grows. Advanced analytics is available on paid plans.
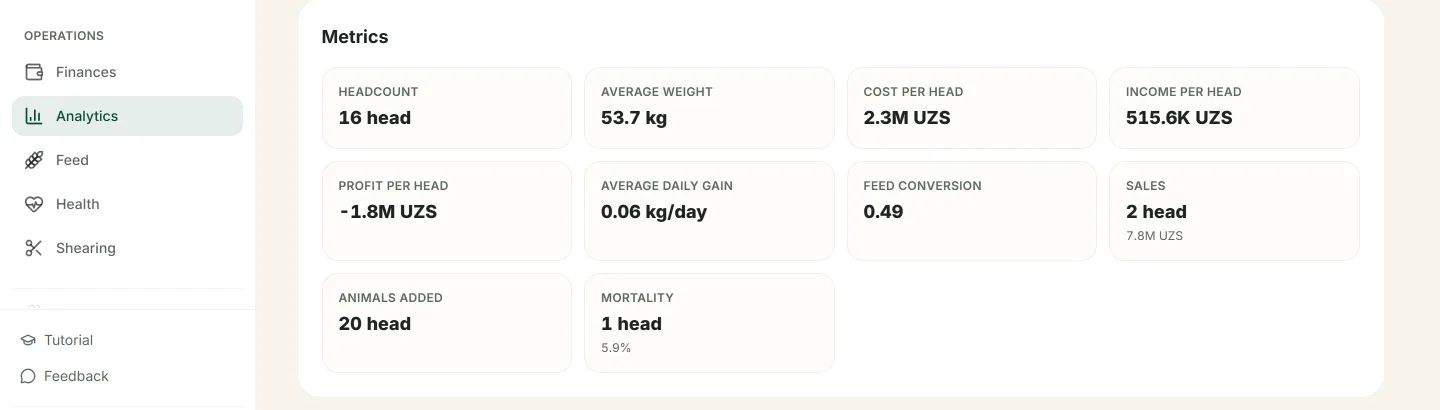
Flock figures for a period: weight, gain and profit per head.
How to read the reports
- 1
Choose a period — a month, quarter, year or your own range.
- 2
Check the key figures: livestock count, average weight, profit per head and gain.
- 3
Open charts for income and expenses, cost structure and flock growth.
- 4
Compare breeds and weight gain across animals.
You see the farm in numbers, not by guesswork.
It's clear what makes a profit and what makes a loss.
It's easy to compare breeds against each other.
Decisions are made on facts.
More features
All featuresBring order to your farm
Put your flock into QoyHunter — records, health, finances and reminders in one app.